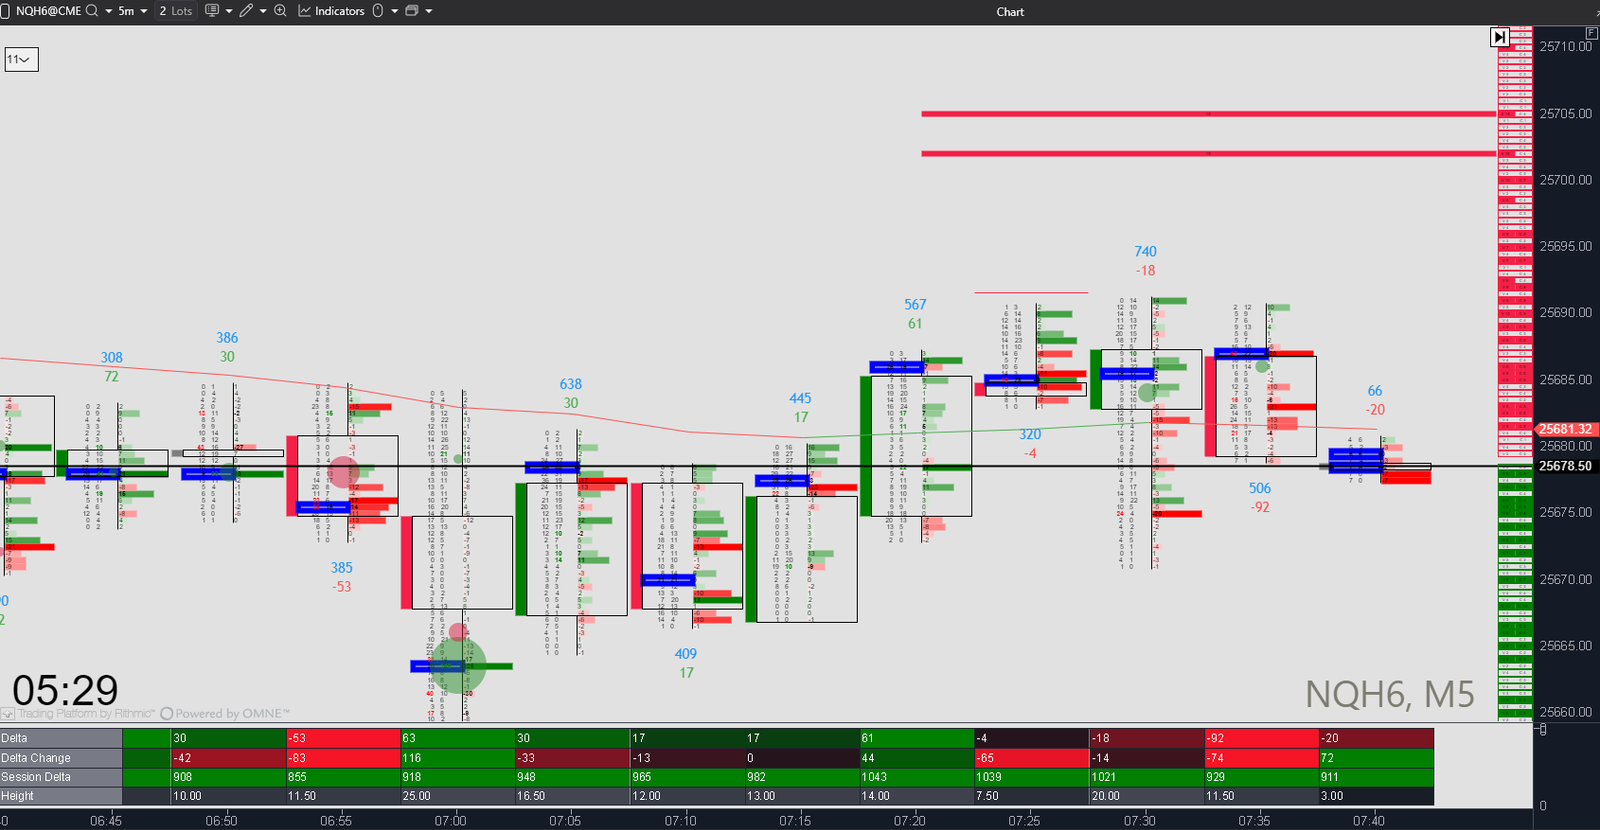
ATAS NQ Footprint Template: RAIN Break & Retest
✅ Overview
Ready-made settings for the ATAS Footprint Chart, built specifically around the RAIN Break & Retest methodology — optimized for NQ’s volatility.
Perfect for intraday trading and fully compatible with the Nasdaq’s higher rotation speed.
Tested on: Futures —2-minute & 5-minute timeframes (ideal for NQ responsiveness).
This template combines volume analysis, footprint signals, and structural logic to help you spot high-probability entries at the exact moment NQ reveals real directional intent.
It’s engineered to identify:
🔹 Break & Retest zones
🔹 Absorption pockets & trapped traders
🔹 POC-driven reversal signals
🔹 Delta confirmation at key decision points
🔹 Rejections at imbalance / inefficiency zones
🔹 Directional shifts aligned with RAIN (R-A-I-N patterns)
Where the strategy shines:
after a structural break
during a clean pullback
at a retest of a key POC or footprint level
when volume exposes a failed breakout or fake move
⚠️ If the template looks compressed or stretched: It’s almost always a vertical scaling issue. Just adjust the price axis to reset the zoom.
⭐ Where the strategy shines (for NQ)
after a structural break during a clean but fast pullback at a retest of a key micro-POC or footprint level when volume exposes a fake breakout or thin-zone drive when NQ overextends and snaps back into structure
⚠️ If the template looks compressed or stretched:
It’s almost always a vertical scaling issue — especially on NQ due to volatility. Just adjust the price axis to reset the zoom.
🧰 What’s Included
✔ 1. RAIN ATAS Workspace Template File
Fully built workspace featuring:
Footprint chart
Delta windows
Volume clusters
Auto-marked POCs
Liquidity zones
Imbalance highlights
Absorption markers
Every element is purpose-built. No noise. No filler.
🌧️ RAIN Pattern Breakdown (NQ Edition)
R — Reversal Pattern
Directional close
Delta confirms with a meaningful shift
Close on the correct side of the POC
Occurs at a structural level or micro-POC zone
Entry: 2 ticks beyond the signal candle POC (NQ requires extra confirmation compared to ES)
A — Absorption Pattern
Massive footprint volume spikes
POC at the extreme or slightly offset
Limit orders absorbing aggressive market orders
“Volume of the Day”–type candles inside thin liquidity
Entry: 1–2 ticks beyond the POC, depending on volatility.
I — Imbalance Pattern
One-sided prints
Imbalance rejects the level
Confirmed shift in aggression
NQ almost always retests imbalances before continuation
Entry: On the imbalance rejection retest.
N — Non-Belief Pattern
Price breaks a level
Delta does not support it
Weak follow-through
Quick snap back inside structure
Entry: Fade the fakeout on the return back inside.
🧩 Core Visuals & Price Action Layers
VWAP (session-based)
EMA structure guide (trend clarity without clutter)
Watermark (instant chart ID)
Bar Timer (precision timing)
Micro-POC sensitivity (important for NQ)
🔥 Footprint & Volume Intelligence
Adaptive Big Trades (aggressive market orders auto-detected)
Candle Statistics (delta, volume, imbalance clarity)
Delta Turnaround Bars (critical on NQ reversals)
Stacked Imbalances (institutional footprints highlighted)
📡 Order Flow Tools
Cluster Search (absorptions, traps, and hidden orders)
MBO DOM Overlay (real-time liquidity behavior)
Absorption markers
Volume cluster mapping
📦 Additional Info
One-time purchase
Immediate download
Works on all ATAS accounts
Optimized for Nasdaq’s volatility and fast rotations